Live webinar | Seconds to Settle, Weeks to Resolve: The Payment Investigations Paradox
Register Now


Not long ago, enterprise applications were built as single, self-contained systems. All the logic, data access, and user interface sat inside a common deployable package. If something went wrong, there were only a few places where the issue could originate, making it relatively straightforward to troubleshoot.
Meanwhile, today's applications work very differently. A single customer interaction might travel through a frontend layer, an API gateway, several independent microservices, a third-party payment processor, a cloud-hosted database, and a CDN, all within a fraction of a second. Each component is developed, deployed, and scaled independently. No one person holds the full picture of how it all fits together.
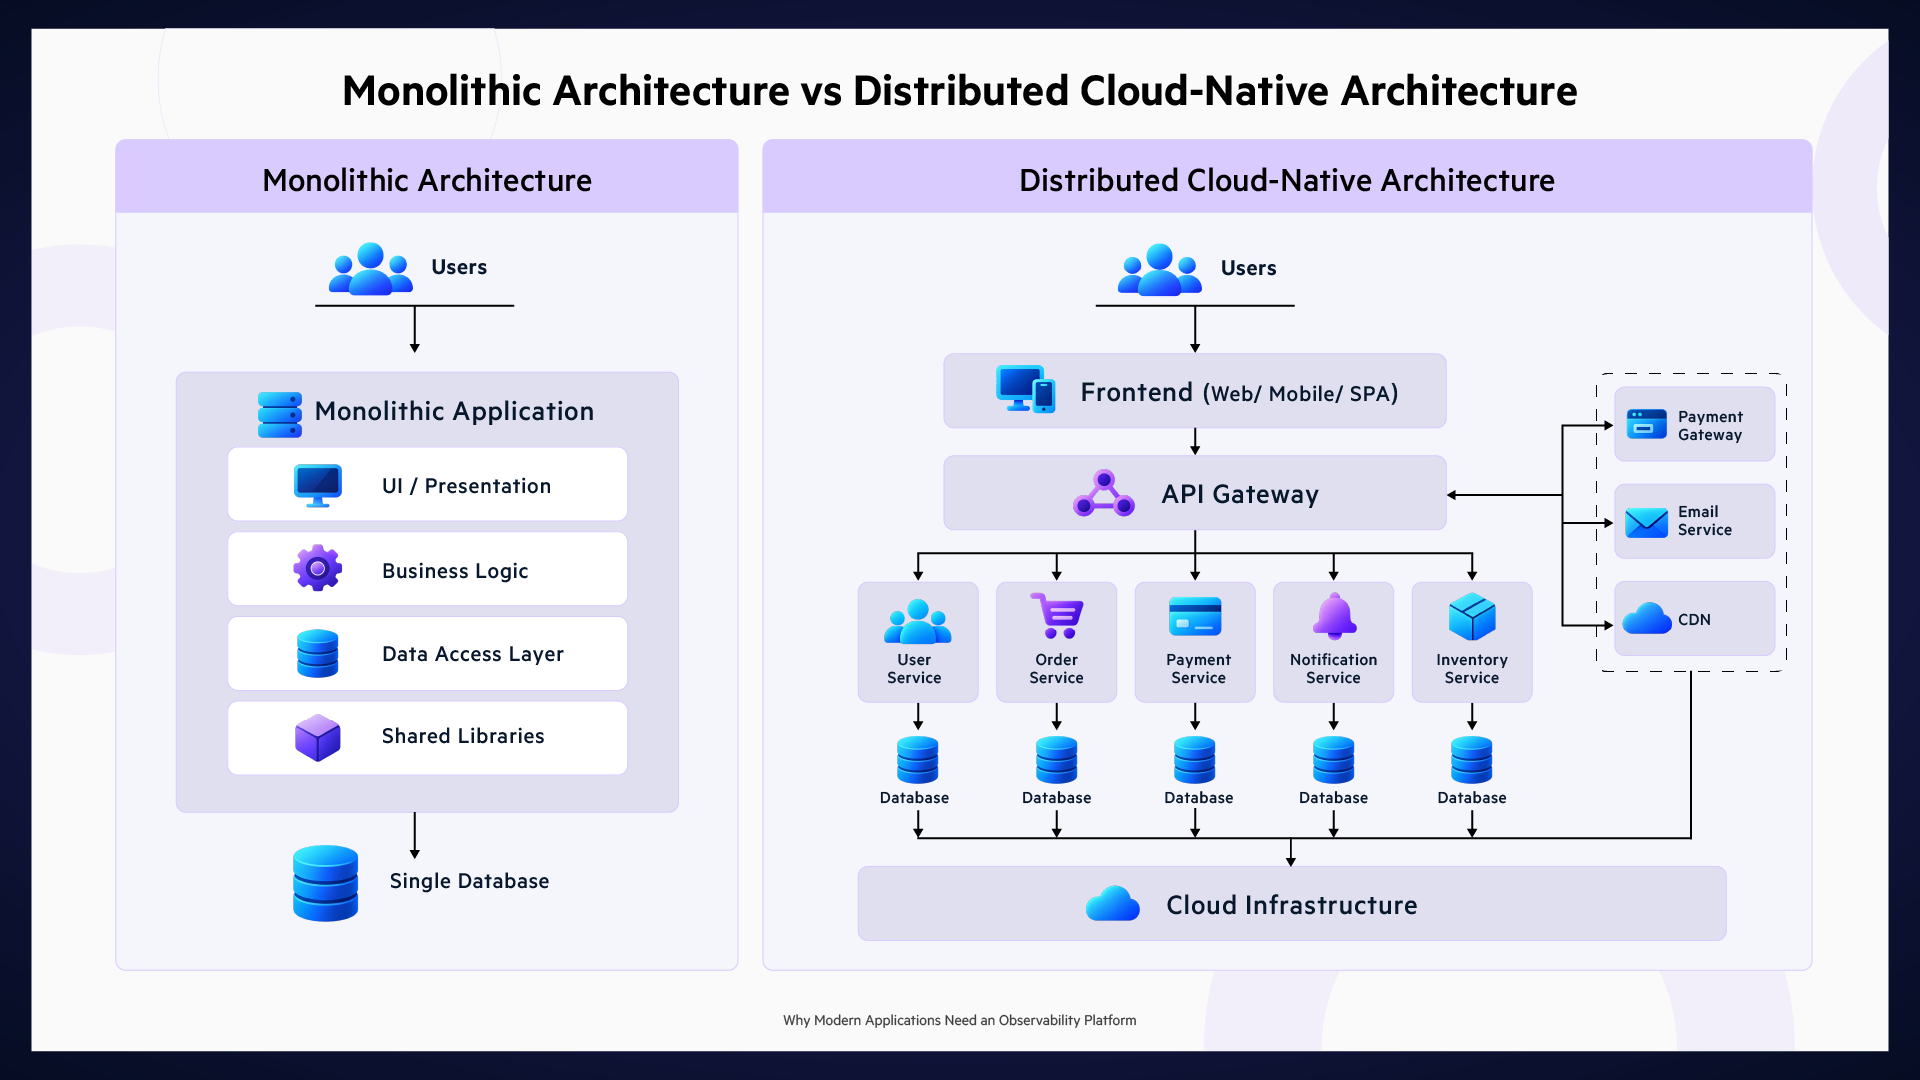
This shift toward distributed, cloud-native architectures unlocked enormous flexibility. It also introduced a new category of operational complexity that traditional monitoring tools fall short of handling.
When a transaction fails today, the root cause might not be in your application at all. It might be a timeout in a third-party API, a misconfiguration in a cloud region, or a cascade triggered by a deployment in a service three hops away. A dashboard showing CPU usage and error rates alone cannot tell you the whole story. It can tell you something went wrong but cannot tell you why, where, or what to do about it.
This is the gap that observability was built to close.
Observability is the ability to understand what is happening inside a system by looking at the data it produces.
A system is described as observable when you can determine its internal state just by studying its outputs. In software, that translates to building systems that generate enough data for engineers to ask any question about them, even questions they did not think to ask before an incident began.
Observability is not a replacement for monitoring, but an evolution of it.
Monitoring detects and alerts you to errors, while observability enables you to understand why the error occurred and who was affected.
It is the practice of collecting and tracking predefined indicators of application health, such as CPU utilization, memory consumption, response time, error rates, and uptime. It helps teams determine whether systems are operating within expected thresholds and generates alerts when those are exceeded.
Unlike monitoring's predefined indicators, observability analyzes metrics, logs, and traces together to give engineers visibility into how an application is behaving. In modern cloud-native applications, this extends further to include metadata, network mapping, user behavior, and code-level details.
Observability relies on three foundational data sources, each offering a different view of system behavior.
Metrics: Numerical measurements collected over time, things like request latency, error rates, and memory consumption.
Logs: These are timestamped records of individual events. Every time your application does something significant, it can write a record of that moment.
Traces: Follow a single request as it travels through an entire distributed system, recording every service it touched and the time spent at each step.
Together, metrics surface the anomaly, logs explain the context, and traces show the path. Each one becomes significantly more useful when paired with the others.
Metrics, logs, and traces are foundational, but on their own they remain disjointed pieces of information that leave engineers guessing why an issue happened.
Modern systems also generate events from infrastructure changes, real-user interaction data from browsers and mobile devices, network telemetry, security signals, and deployment metadata. None of these fit neatly into the traditional three pillars, but all of them add context that can be critical during an incident. This naturally raises another question: how do organizations collect and connect all this data consistently?
To address this, modern observability extends beyond the traditional three pillars with capabilities such as:
Implementing observability follows a logical sequence. First, you instrument your application, adding code or deploying agents that generate telemetry data as the system runs. That data is collected and forwarded to a centralized platform, where it is processed, correlated, and made available through dashboards, queries, and alerts.
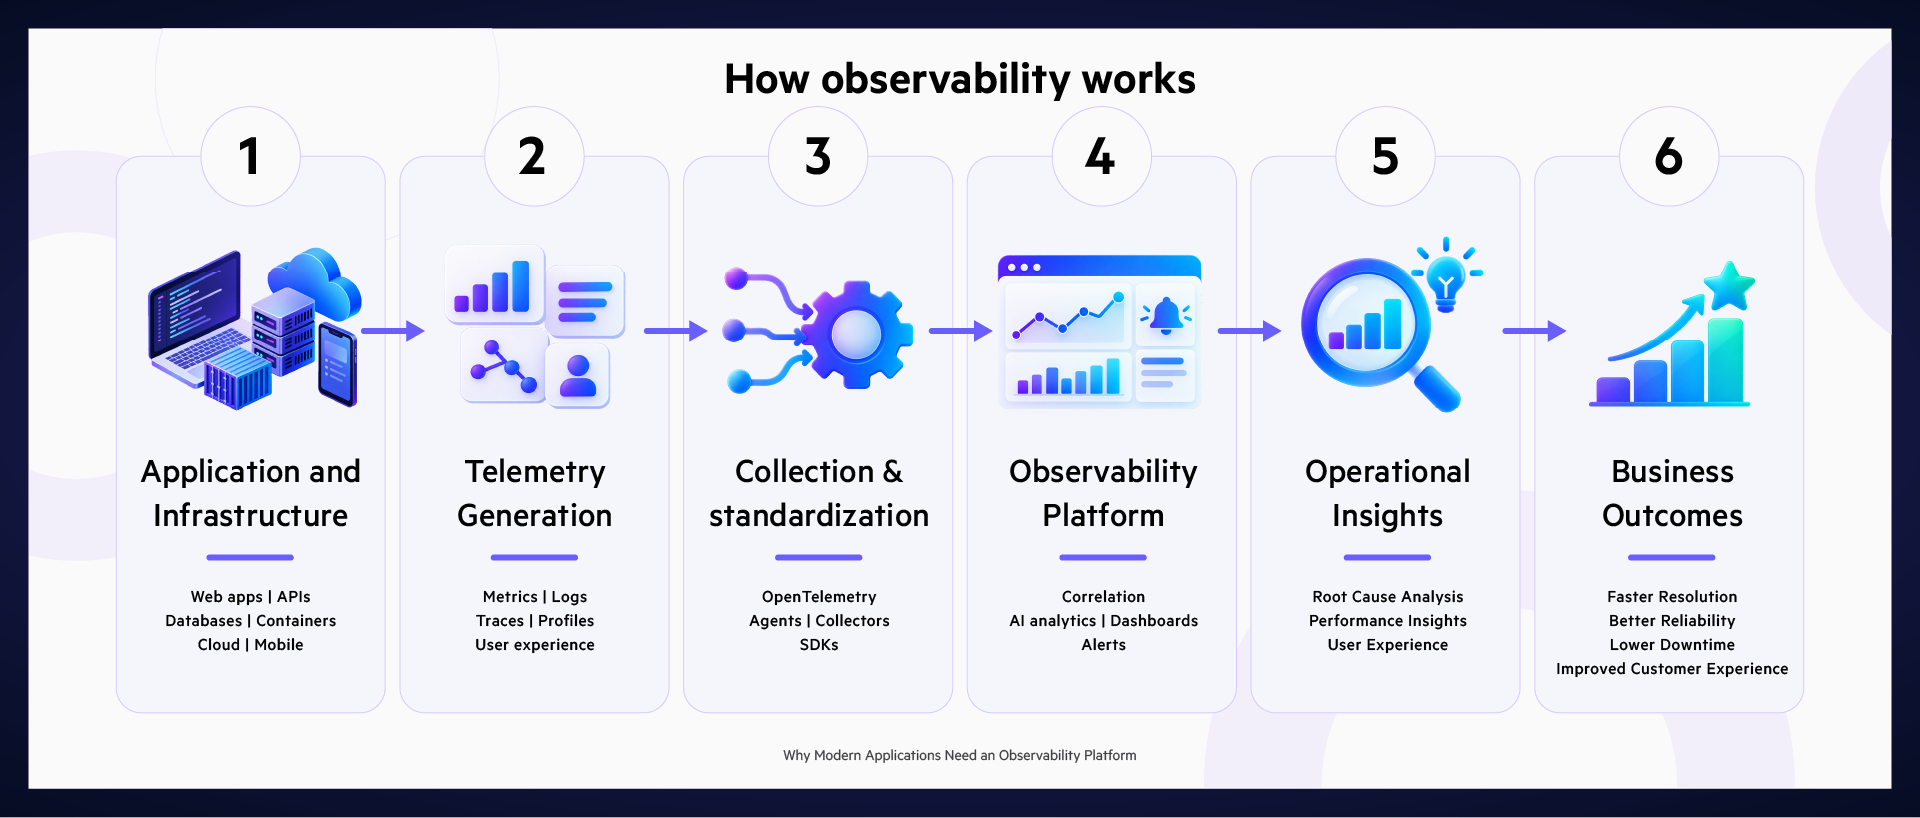
The ecosystem of tools that supports this workflow has matured considerably. Platforms like Datadog, Grafana, Dynatrace, Splunk, and New Relic each approach this workflow with different strengths. What matters more than choosing the right tool is whether the organization has a clear strategy for collecting and using telemetry before selecting a platform. A tool without a strategy produces dashboards nobody trusts.
Understanding the challenges is just as important as understanding the benefits, especially before an organization commits to an observability strategy.
These challenges do not make observability less valuable. They make it clear that observability requires deliberate planning, not just tool deployment.
Effective observability offers clear and concrete operational benefits. Incidents that once took hours to diagnose can now be resolved in minutes, as engineers can track telemetry directly to the source. Richer data simplifies system reasoning, reducing deployment surprises and firefighting.
Customer experience improves when performance issues are identified before users notice them. Teams work better when they share a common view of operations. Observability data helps guide product and business decisions. It connects technical performance to conversion rates and service reliability, benefiting not just the engineering team but the entire organization.
Pega applications sit at the center of critical business processes for many enterprises. In these environments, degraded performance or unexpected downtime aren’t just an inconvenience for engineers but affect the business directly.
Pega deployments today interact with cloud infrastructure, external APIs, data lakes, and enterprise systems of record. They go through version upgrades, configuration changes, and scaling events. The number of moving parts is significant, and the cost of an undetected issue is high.
Unified operational visibility across the application layer, infrastructure, and integrations that connect Pega to the rest of the environment is no longer optional. Without it, teams spend too much time locating problems, not solving them.
We believe at EvonSys that this shift represents a broader evolution in enterprise operations, one that will continue to shape how teams build, manage, and optimize their digital ecosystems.
Don't Let Operational Blind Spots Impact Your Pega Platform.
If you are thinking about what stronger operational visibility looks like for your Pega environment, our managed services team is ready to help.